Curated ToolThis tool is part of our curated AI directory. We only include tools that meet our standards for relevance, usability and real-world value.

Whatagraph

Governed marketing data layer for AI queries and tool access

Analytics & Reporting
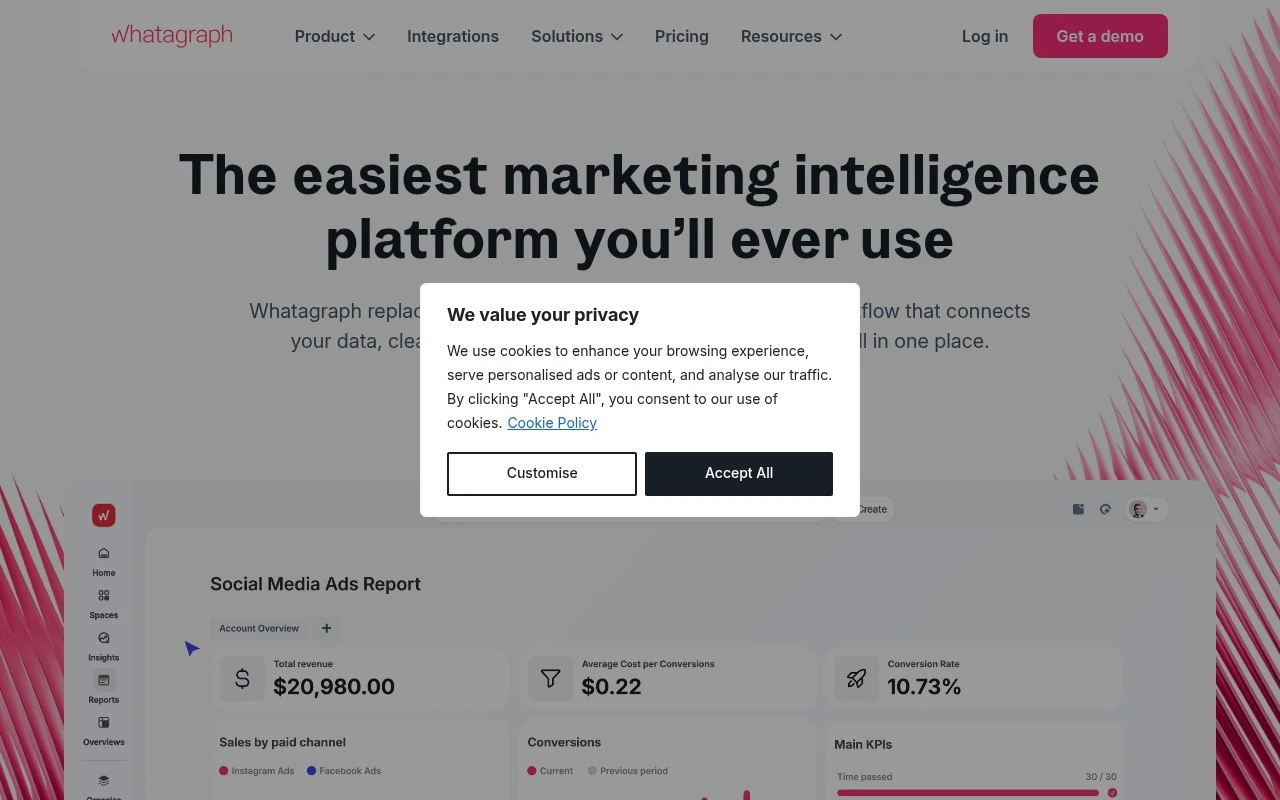
Whatagraph helps marketing teams replace fragmented reporting workflows with one governed data foundation for cross-channel marketing data. It is built around defining metrics once, then reusing the same numbers in client reports, internal dashboards, and AI-assisted analysis so teams do not have to reconcile results across separate tools.

FYAI Score

8.6 / 10

Based on 279 reviews

Pricing:

Paid only

Best for:

Marketing agencies and in-house teams standardizing cross-channel reporting

Score Breakdown

  • Ease of use8.7 / 10
  • Features8.6 / 10
  • Pricing7.9 / 10
  • Integrations8.8 / 10
  • Support9.0 / 10

PRODUCT PREVIEW

What this AI tool does

Whatagraph is a reporting and dashboard tool designed to help teams turn marketing and analytics data into clear, shareable visuals. It’s commonly used by agencies and in-house marketers who need a consistent way to monitor performance across multiple channels and present results to clients or stakeholders. The platform focuses on bringing data from different sources into one place, then organizing it into reports that can be viewed online or delivered on a schedule. This can reduce the time spent compiling updates manually and make it easier to keep reporting formats consistent across campaigns. For informational use, it’s helpful to think of whatagraph as a workflow for collecting metrics, arranging them into a readable narrative, and distributing the final output to the right audience. It’s best suited for teams that report regularly and want a repeatable process for dashboards and recurring performance summaries.

Use cases

Best for

Dashboard Generation

Generate cross-channel marketing dashboards from a governed metric layer so the same KPIs stay consistent across views.

Data Visualization

Whatagraph visualizes marketing performance by turning defined metrics into charts and tables for reports and dashboards.

Business Intelligence

Use a governed data foundation to analyze cross-channel marketing data and reuse defined metrics in AI-assisted insights.

ANALYSIS

Strengths & limitations

Strengths
  • Designed for reporting at scale across many client accounts, locations, brands, or markets.
  • Supports reusable reporting structures such as linked reports, scalable themes, white-label reports, branded folders, and templates.
  • Positions the same governed marketing metrics for use across reports, dashboards, BigQuery, Slack and email delivery, MCP, and AI chat.
Limitations
  • The product is clearly centered on marketing data, so it may not fit teams looking for a broad general-purpose BI platform outside marketing reporting.
  • Some AI roadmap items, such as AI agents, are described as coming soon rather than fully available.
  • The site emphasizes scaled reporting teams, which may make it more than a very small business needs for simple one-off dashboards.

Evaluation

FYAI score breakdown

Our structured evaluation across five key criteria

8.6 / 10

Overall score

Based on 279 reviews

  • Ease of use8.7 / 10
  • Features8.6 / 10
  • Pricing7.9 / 10
  • Integrations8.8 / 10
  • Support9.0 / 10

What users say

Findings from public reviews, documentation and community sources.

  • Ease of use

    G2’s 279-review product signal says users “consistently praise the ease of use and customization options” and highlight creating visually appealing reports quickly.

  • Features

    Whatagraph’s features page describes “60+ integrations,” no-code transformations, custom metrics, and destinations such as BigQuery and Looker Studio.

  • Pricing

    Whatagraph’s pricing page lists Max at “€699 from per month, billed annually” with 50+ source credits, unlimited users/reports, a 14-day trial, and live chat/support. The pricing page says Prime is custom-priced and some items are add-ons.

  • Integrations

    Whatagraph’s features page lists “60+ integrations” across PPC, social, email, analytics, CRM, SEO, eCommerce, calls, custom connections, API, Google Sheets, BigQuery, and on-demand sources.

  • Support

    Whatagraph’s pricing page states that all plans include “live chat support and regular office hours.” The pricing page says Max and Prime include a “Dedicated Customer Success Manager,” and Prime adds tailored onboarding and priority support.

Who is this for?

Best for marketing teams or agencies that need multi-channel reporting, Whatagraph’s features page lists “60+ integrations” and destinations such as BigQuery and Looker Studio. Less suited to teams looking for a low public entry price, Whatagraph’s pricing page lists Max at “€699 from per month, billed annually,” while Prime is custom-priced and some items are add-ons.

PRODUCT PREVIEW

Feature highlights

Governed metrics

Define KPIs once and reuse the same numbers across every report.

Cross-channel data

Bring ad, web, and CRM data into one consistent reporting view.

AI-assisted analysis

Turn unified data into faster insights without manual digging.

COMPARE

Discover curated alternatives worth comparing

Compare similar AI tools based on features, pricing and use cases

7.5/ 10Based on 12.890 reviews

Zoominfo

Lead GenerationCRM & Segmentation
Find and enrich B2B leads with firmographic and contact data
Best for:
Sales teams
Pricing
Paid only

8.6/ 10Based on 6.982 reviews

Zoho CRM

Sales & OutreachAnalytics & Reporting
AI assists CRM tasks: rewrite emails, detect anomalies, predict
Best for:
Sales teams
Pricing
Freemium

8.0/ 10Based on 1.041 reviews

Zoho Campaigns

Lead GenerationCRM & Segmentation
Create, automate, and analyze email and SMS marketing campaigns
Best for:
Marketing teams
Pricing
Freemium

Join teams that ship client-ready marketing reports in minutes, not hours. Start automating your reporting today and keep stakeholders aligned with clear results.

FAQ

Frequently asked
questions

Everything you need to know about this AI tool,
its features, pricing, use cases, and limitations.

Whatagraph is best for which reporting use cases, and when should I pick something else?
Whatagraph fits agencies and in-house marketing teams that need recurring, client-ready performance reports across multiple channels (ads, social, SEO, email). It’s a strong choice when you want templated dashboards and automated delivery rather than custom analysis. If your priority is deep attribution modeling, product analytics, or exploratory analysis, a dedicated analytics platform may be a better match.
Does Whatagraph have a free plan, and what are the practical limits of paid plans?
Whatagraph is typically positioned as a paid product; if a trial is available, it’s mainly for evaluation rather than ongoing use. Paid tiers usually scale by factors like number of data sources, users, workspaces/clients, and reporting volume. Before choosing, confirm connector availability and any caps on scheduled exports or client accounts that could affect your workflow.
How does Whatagraph compare with alternatives like Looker Studio, Supermetrics, or AgencyAnalytics?
Compared with Looker Studio, Whatagraph generally requires less manual dashboard building and is more oriented toward polished, repeatable client reporting. Versus Supermetrics, Whatagraph is more of an end-to-end reporting layer, while Supermetrics is often used mainly for data extraction into other tools. Against AgencyAnalytics, Whatagraph tends to emphasize flexible report design and multi-source reporting, but the best fit depends on which connectors and client management features you need.
How long does it take to set up Whatagraph for a multi-client agency, and what slows onboarding down?
Whatagraph is strong for automated reporting, but it may feel limited if you expect advanced analytics, complex transformations, or highly customized data modeling inside the tool. Pricing can be higher than simpler reporting options, especially as you add clients and connectors. If your team needs heavy data prep, you may end up pairing it with a warehouse or BI tool.
What should I check about data handling, privacy, and compliance when using Whatagraph?
Verify where Whatagraph stores and processes data, what sub-processors are involved, and whether it supports a DPA for your organization. Confirm how connector credentials are managed (e.g., OAuth), whether you can control user access by workspace/client, and what audit or activity logs are available. If you handle regulated data, check options for data retention, deletion, and any compliance certifications relevant to your requirements.